10 Ways to Get the Most Out of ArcGIS Living Atlas of the World
September 27, 2024 2024-09-27 13:4210 Ways to Get the Most Out of ArcGIS Living Atlas of the World
10 Ways to Get the Most Out of ArcGIS Living Atlas of the World
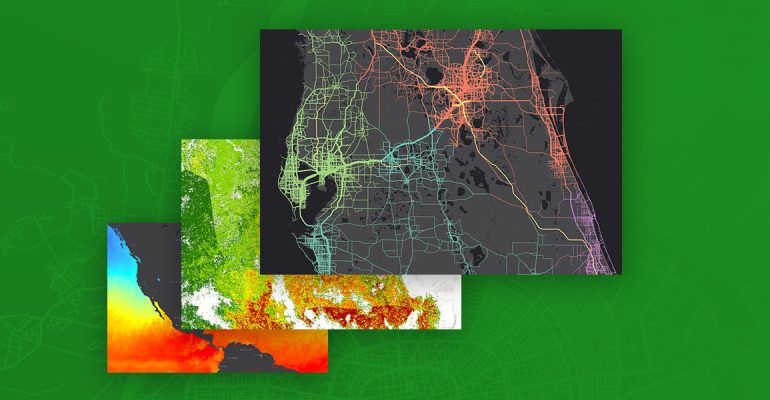
The ArcGIS Living Atlas of the World is a treasure trove of geographic information, providing a wealth of authoritative data, maps, and layers that can be used to understand the world and address a wide range of challenges. Whether you are working in urban planning, disaster management, environmental conservation, or business analytics, the Living Atlas offers a rich array of tools and datasets. To help you make the most of this resource, here are ten ways to get the most out of ArcGIS Living Atlas of the World.
Related: Africa GeoPortal
1. Leverage Ready-to-Use Data for Your Projects
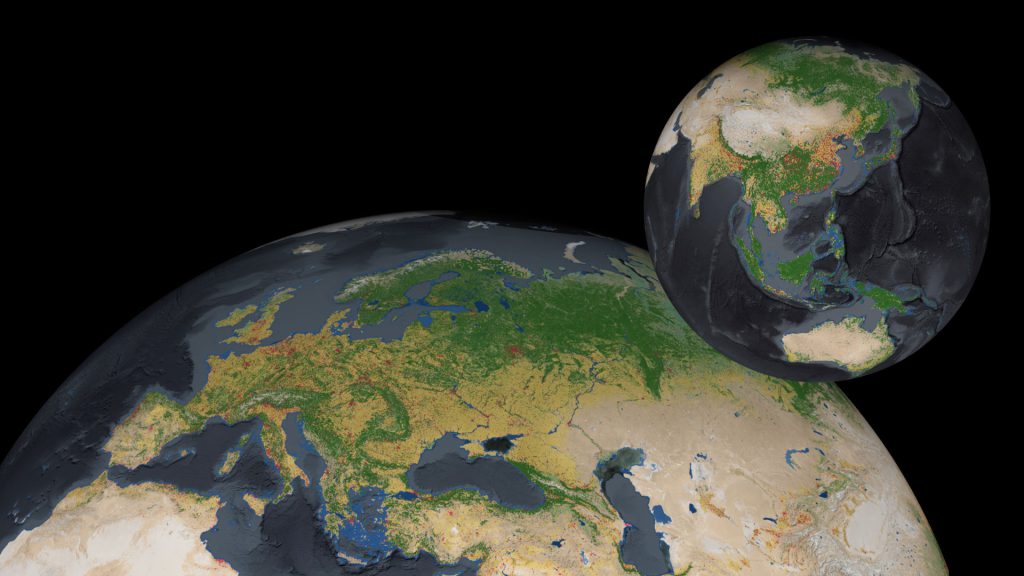
The ArcGIS Living Atlas provides a vast collection of ready-to-use data, from demographic information and environmental data to real-time weather and traffic. Instead of spending time gathering and processing data, you can access curated datasets that are updated regularly. For example, you can easily find authoritative data on global land cover, population density, or biodiversity patterns to integrate into your GIS projects without having to source the data elsewhere.
2. Access Real-Time Data for Situational Awareness
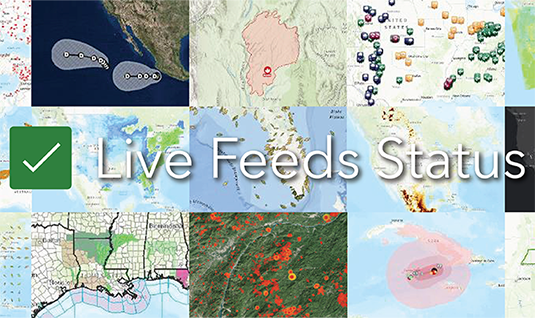
One of the most powerful features of the Living Atlas is its real-time data feeds. These include weather patterns, traffic conditions, air quality, and natural disasters like earthquakes and wildfires. By incorporating these live data streams into your maps, you can gain up-to-the-minute situational awareness for emergency response, disaster management, and operational planning. Real-time data is particularly useful for monitoring changing conditions and responding quickly to new developments.
For example, during hurricane season, you can use the Living Atlas to track storms, monitor flood risks, and predict the impact on local communities. This real-time insight is invaluable for decision-makers in government, public safety, and humanitarian aid.
3. Use High-Quality Basemaps for Better Visualizations
Basemaps are the foundation of most GIS projects, providing essential geographic context for your data. ArcGIS Living Atlas offers a wide selection of high-quality basemaps, including topographic maps, satellite imagery, street maps, and terrain models. These basemaps are designed to provide detailed, accurate representations of the world, and they are regularly updated to reflect changes in the environment.
By selecting the right basemap for your project, you can ensure that your maps are both visually appealing and informative. For example, if you are working on environmental conservation, a satellite basemap can provide detailed views of forest cover, water bodies, and land use, enhancing your analysis and presentation.

4. Explore Demographic Data for Market and Policy Insights
If you are working in urban planning, marketing, or public policy, demographic data from the Living Atlas can provide critical insights into population trends, income levels, education, and more. This data is regularly updated, allowing you to analyze shifts in population distribution, predict market demand, or plan for future infrastructure needs.
For instance, a local government agency might use demographic data to map out underserved communities and allocate resources such as healthcare, schools, and public transport more effectively. Businesses can also tap into this data to understand their target markets better and tailor their services accordingly.
5. Enhance Your Maps with Thematic Layers
ArcGIS Living Atlas contains a variety of thematic layers that allow you to add context to your projects. These layers cover a wide range of topics, including climate change, agriculture, biodiversity, land use, and urban growth. By incorporating these layers into your maps, you can create more informative visualizations that tell a story and drive decision-making.
For example, if you’re working on a project related to sustainable agriculture, you can use thematic layers that show soil quality, precipitation patterns, and crop productivity. Combining these layers with your data will provide a more comprehensive understanding of agricultural conditions and help inform better land management practices.

6. Perform Powerful Spatial Analysis
The Living Atlas is not just about data visualization—it also allows users to perform advanced spatial analysis. With tools like ArcGIS Pro or ArcGIS Online, you can use Living Atlas data to run spatial queries, perform overlay analysis, and create predictive models. Whether you’re calculating the impact of climate change on coastal areas or identifying optimal locations for new infrastructure, the Living Atlas offers the spatial data needed to make informed decisions.
For instance, a transportation agency might use the Living Atlas to analyze traffic patterns and congestion, identify bottlenecks, and plan for future road expansions or public transit systems. The ability to perform spatial analysis directly within the GIS environment saves time and ensures more accurate results.
7. Collaborate and Share Insights Using ArcGIS Online
The ArcGIS Living Atlas is seamlessly integrated with ArcGIS Online, enabling easy sharing and collaboration on GIS projects. Users can create web maps, dashboards, and story maps that incorporate Living Atlas data and then share these products with colleagues, stakeholders, or the public. This feature is especially useful for organizations that need to collaborate on spatial analysis and make data-driven decisions across multiple teams.
For example, conservation organizations can create interactive maps that showcase wildlife migration patterns or deforestation rates and share them with partners and donors. Similarly, public health agencies can use shared maps to track disease outbreaks and coordinate responses across different regions.
8. Monitor Environmental Changes Over Time
One of the most valuable applications of the Living Atlas is the ability to track environmental changes over time. By accessing historical data on land use, vegetation cover, and urban development, you can analyze how different regions have evolved and predict future changes. This is particularly important for tracking the impacts of climate change, deforestation, and urbanization.
For example, using Living Atlas data, environmental researchers can create time-lapse visualizations that show how coastal areas are shrinking due to rising sea levels, or how forest cover is decreasing due to deforestation. This capability allows for more informed conservation and policy efforts.
9. Use StoryMaps to Communicate Your Findings
ArcGIS StoryMaps is a powerful tool for turning your GIS data into compelling narratives. By combining maps, text, images, and videos, you can create interactive stories that engage and inform your audience. The Living Atlas offers a wealth of data and basemaps that can be incorporated into StoryMaps to make your projects more impactful.
For example, if you are working on a conservation project in East Africa, you can create a StoryMap that highlights endangered species, deforestation hotspots, and ongoing conservation efforts. This narrative-driven approach is an excellent way to raise awareness, share research, or advocate for policy changes.
10. Stay Updated with Curated Data and New Releases
The ArcGIS Living Atlas is continuously updated with new datasets, layers, and maps. By regularly checking for updates, you can ensure that you’re always using the latest and most accurate data for your projects. Esri’s team curates and verifies the data, ensuring its quality and reliability for a wide range of applications.
To stay updated, you can follow the Living Atlas blog, attend webinars, and participate in the Living Atlas community. This will keep you informed about new releases, features, and case studies that showcase how other users are leveraging the Living Atlas in innovative ways.
By incorporating these ten tips into your workflow, you can maximize the potential of the Living Atlas and unlock new insights for your projects. As GIS technology continues to evolve, the Living Atlas will remain a cornerstone for spatial analysis, data visualization, and informed decision-making across the globe.
Unlock the full potential of your GIS projects by integrating powerful, real-time data from ArcGIS Living Atlas—start enhancing your workflows today! https://livingatlas.arcgis.com/en/home/

