5 Tips to Jumpstart Your Spatial Analytics
November 5, 2024 2024-11-05 8:395 Tips to Jumpstart Your Spatial Analytics
5 Tips to Jumpstart Your Spatial Analytics
Spatial analytics is revolutionizing how industries like urban planning, retail, environmental management, and public health make decisions. By analyzing data in a geographic context, organizations can uncover patterns and insights that drive data-driven decisions. If you’re looking to get started with spatial analytics, here are five essential tips to jumpstart your journey.
Related: Three Things ArcGIS Spatial Analyst Can Do for You
1. Start with Clear Objectives
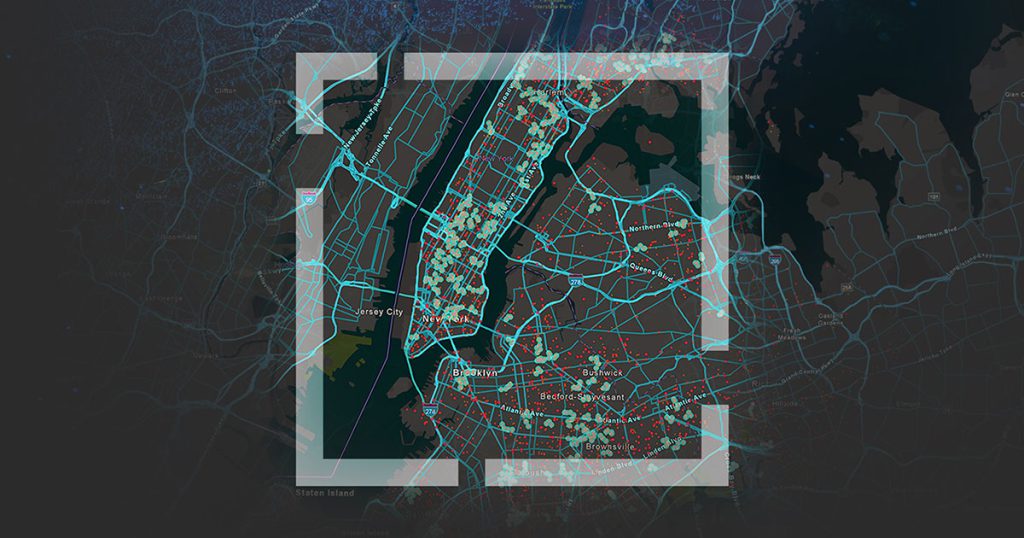
Defining a clear objective is crucial in any analytical process, and spatial analytics is no different. Begin by identifying what you aim to achieve. Are you looking to optimize a delivery route, identify ideal retail locations, or assess environmental risk? Clear objectives will guide your data collection, analysis methods, and visualization, ensuring that your work is purposeful and relevant. A well-defined goal will also make it easier to select the right tools and metrics for analysis, saving time and enhancing results.
2. Choose the Right Data
High-quality data is the foundation of accurate spatial analysis. Start by identifying relevant data sources—these could include satellite imagery, census data, demographic information, or data from mobile GPS sources. Public data sources such as Esri’s ArcGIS Living Atlas of the World, OpenStreetMap, and government GIS portals offer valuable datasets for free or at minimal cost. Always check the reliability, recency, and resolution of your data, as outdated or low-quality data can skew your results. Combining spatial data with business data, like sales figures or customer demographics, can also add valuable context to your analysis.
3. Master the Basics of GIS Software
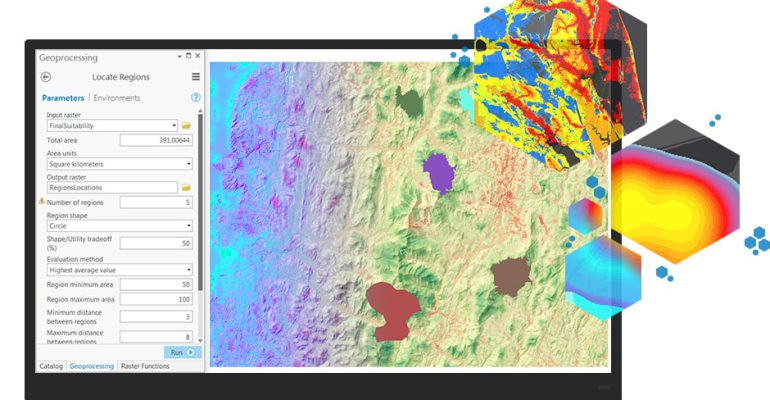
To analyze spatial data effectively, familiarize yourself with popular GIS software like ArcGIS . These platform offers tools for mapping, visualization, and spatial analysis that can bring your data to life. Start with simple functions, such as creating layers and performing basic spatial queries, then progress to advanced analysis like overlay, buffer, and hotspot analysis. ArcGIS Online is a great starting point, as it provides user-friendly, cloud-based tools that allow you to map and analyze data from any device.

4. Leverage Visualization Techniques
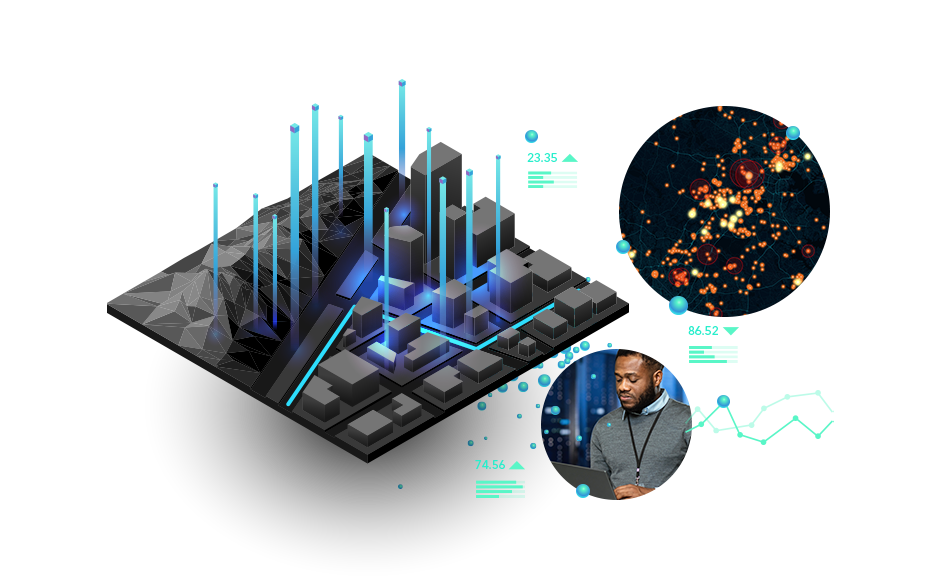
Spatial analytics becomes impactful when you visualize the results clearly. Use maps, heatmaps, choropleth maps, and 3D models to highlight patterns and trends. Effective visualization not only makes your data more understandable but also helps stakeholders grasp key insights quickly. Tools like ArcGIS Dashboards can help you create interactive visuals that display real-time data, enabling dynamic and actionable insights. Good visualization tells a story, allowing your audience to connect with your findings intuitively.
5. Incorporate Spatial Statistics
Spatial statistics add depth to your analysis by quantifying spatial relationships. Techniques like hot spot analysis, spatial autocorrelation, and regression analysis allow you to uncover patterns, assess clustering, and make predictive models. For instance, hot spot analysis can reveal areas with high activity or need, such as crime hotspots or disease outbreaks. Spatial statistics move beyond basic visualization, providing measurable insights that can support strategic planning and problem-solving.
Jumpstarting your spatial analytics journey is all about setting clear goals, sourcing quality data, using the right tools, visualizing effectively, and applying statistical techniques. By following these steps, you’ll be well-equipped to make informed, data-driven decisions that leverage the power of location. Spatial analytics is not just about maps; it’s about making complex relationships in the data visible and actionable.
Join the Going Places with Spatial Analysis MOOC and start building your spatial analysis journey.

