Explore Seven Fresh Features in ArcGIS StoryMaps
April 24, 2025 2025-04-24 14:19Explore Seven Fresh Features in ArcGIS StoryMaps
The ArcGIS StoryMaps team continues to enhance storytelling tools to help users craft visually compelling and engaging narratives with ease. Over the past six months, several new features have been added—including templates, interactive charts, advanced embedding tools, and more. Here are seven exciting ways you can elevate your storytelling using the latest capabilities in ArcGIS StoryMaps:
1. Build Faster with Story Templates
Story templates provide a ready-made structure that others can customize. They’re perfect for organizations that need consistency across multiple stories or for educators setting up student assignments.
Templates are created from the Stories page and function much like a standard story—with one key difference: you can include instructional blocks. These blocks guide collaborators but won’t appear in the final, published version. When others duplicate the template, they can edit their version freely while following your directions.
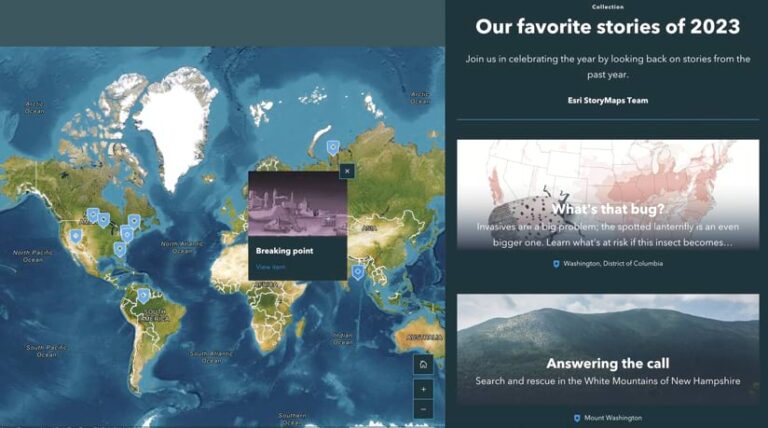
2. Map Out Your Collection Items
Collections help you group related content, and now you can display those items geographically. By enabling Show map in the Design panel, you can assign locations to collection items, which will appear as clickable pins on a map. This feature adds an interactive, spatial element to your content navigation.
3. Make Media the Foundation of Your Express Map
Express maps now support media as a base layer—just like in Map Viewer. You can use an image (e.g., a scanned drawing, site plan, or aerial photo) as your map’s background, and then add annotations, drawings, and map features directly on top of it. This is great for customized storytelling and enhances interactivity through media actions.
4. Control Map Extent or Scale Across Devices
With audiences viewing your stories on all kinds of screens, maintaining a consistent map appearance is essential. A new setting under Map view options allows you to choose whether your map retains its geographic extent or its scale, ensuring a smooth viewing experience regardless of screen size.

5. Create Interactive Charts Within Stories
You can now add interactive data visualizations directly into your stories! Choose from bar, line, column, and donut charts to present trends or comparisons. Simply input your dataset, and the chart will enhance your narrative with clear, engaging visuals.
6. Embed Stories with Full Custom Control
The new script embed option gives you greater control when embedding a story into a webpage. By enabling advanced embedding in the story settings and defining your trusted domains, you can integrate stories into your site with custom CSS and JavaScript—resulting in a seamless, branded experience.
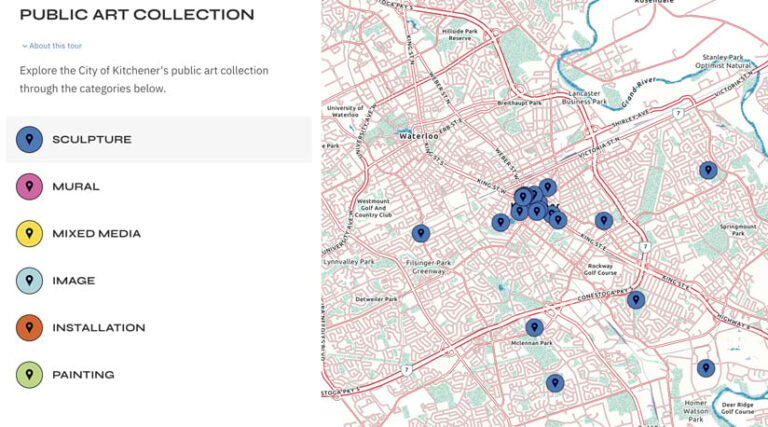
7. Add Thematic Categories to Map Tours
Map tours just got even better. Now you can organize tour items into categories like landmarks, dining spots, or hiking trails. This lets readers filter content by theme, making navigation more intuitive and personalized. While currently available when using a feature service, this functionality will soon be available for map tours built from scratch.
Each of these features opens new possibilities for how you present information, engage your audience, and deliver impactful stories with ArcGIS StoryMaps.