How to Make Your First Interactive Map with ArcGIS StoryMaps
November 5, 2024 2024-11-05 9:44How to Make Your First Interactive Map with ArcGIS StoryMaps
How to Make Your First Interactive Map with ArcGIS StoryMaps
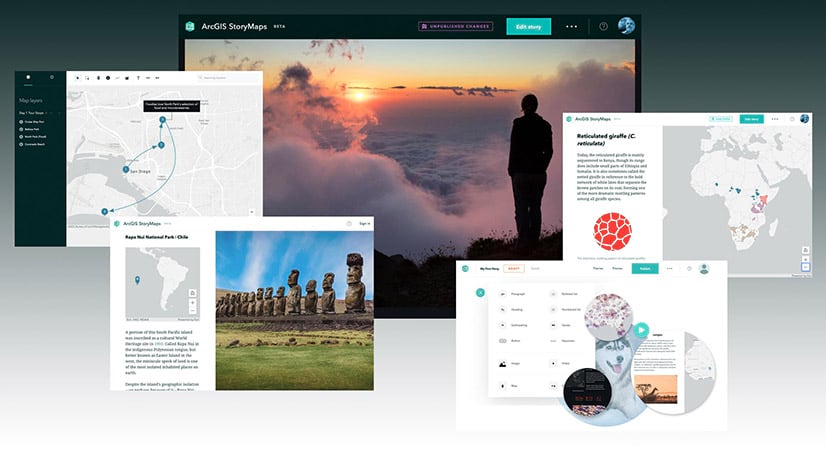
Creating an interactive map with ArcGIS StoryMaps is an exciting way to tell stories through data, engaging audiences with visuals and interactive elements. ArcGIS StoryMaps combines maps with multimedia content, text, and design features to create compelling narratives. Whether you’re a GIS professional, student, or enthusiast, StoryMaps is accessible and straightforward. Here’s a step-by-step guide to making your first interactive map.
Related: Simplified Learning with ArcGIS Story Maps

Step 1: Set Up Your Project and Choose a Story
The first step is to identify the story you want to tell. StoryMaps works best when you have a clear topic or narrative structure. Consider what insights you want to convey, the data needed, and the intended audience. This clarity will guide your map’s layout, design, and functionality. For instance, if you’re creating a StoryMap about urban growth, your story might focus on population density, green spaces, or infrastructure development.
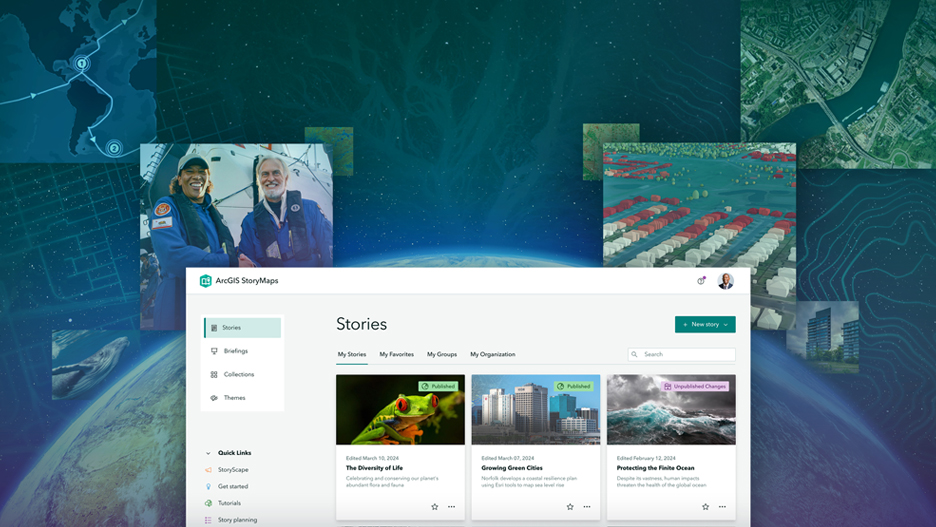
Next, log in to ArcGIS Online or ArcGIS Enterprise and launch ArcGIS StoryMaps from your dashboard. Once there, click on “New Story” to start your project. Choose a template that suits your needs. For first-time users, the “Sidecar” layout is a versatile choice, allowing text, images, and maps to flow together on each slide.
Related: Exciting Updates in ArcGIS StoryMaps (April 2024)

Step 2: Create and Customize Your Map
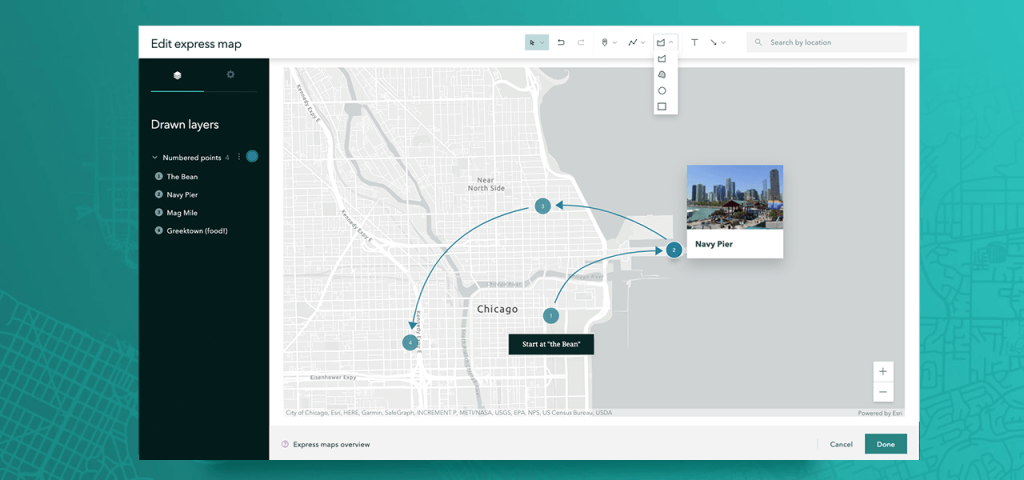
Now, it’s time to create the interactive map element. From the StoryMaps interface, click on “Add Content” and select “Map.” You can choose an existing map from your ArcGIS Online content, or create a new map by clicking “Create Express Map,” which provides basic mapping tools for adding points, lines, and polygons.
For more advanced mapping, use Map Viewer to add data layers, customize symbology, and adjust basemaps. Import data by uploading files or accessing Esri’s Living Atlas, which provides high-quality datasets on demographics, environment, climate, and more. Use labels, color schemes, and icons to make your data clear and visually appealing. Save the map and return to StoryMaps to place it within your story.
Step 3: Add Multimedia Elements
ArcGIS StoryMaps enables you to enrich your map with images, videos, and text. Adding multimedia content brings your map to life, helping the audience connect with your narrative. Click “Add Media” to upload photos, link videos, or include graphics. Accompanying text provides context, guiding viewers through your data and highlighting key insights.

Step 4: Configure Interactive Elements
ArcGIS StoryMaps allows you to add interactive elements like pop-ups, filters, and legends, enhancing viewer engagement. Configure pop-ups to provide additional details on specific locations, allowing viewers to explore points of interest. Filters enable users to view data by specific categories, offering a customized experience.
Step 5: Preview and Share Your StoryMap
Before publishing, preview your StoryMap to ensure everything functions and looks as intended. Test interactive elements and proofread text for accuracy. When ready, click “Publish,” and choose your sharing settings. StoryMaps can be shared publicly, with select groups, or within your organization.
ArcGIS StoryMaps transforms data into an engaging visual story. By following these steps, you’ll create an interactive map that captivates audiences and communicates your insights effectively. Whether for professional projects, educational purposes, or storytelling, your StoryMap will stand out, making complex information accessible and visually engaging.
Start creating your own interactive maps today—explore ArcGIS StoryMaps and more at the Esri Eastern Africa Online Store!


