Utilizing ArcGIS Insights for Data-Driven Decision Making
July 1, 2024 2024-07-01 13:27Utilizing ArcGIS Insights for Data-Driven Decision Making
Utilizing ArcGIS Insights for Data-Driven Decision Making
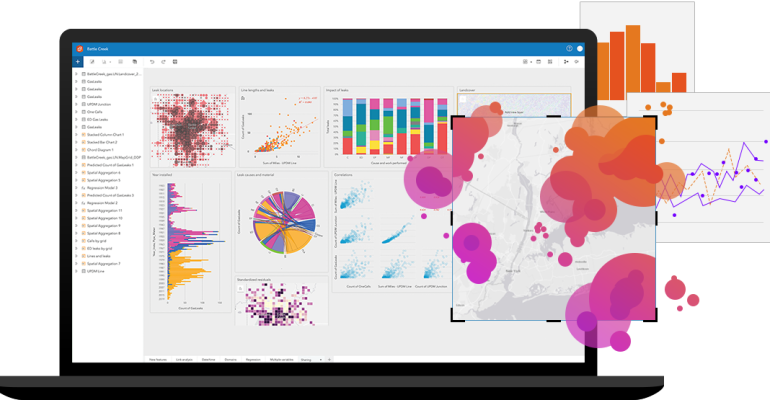
In today’s data-driven world, organizations are constantly seeking ways to harness the power of data to drive decision-making. One of the most powerful tools available for this purpose is ArcGIS Insights. This advanced analytics tool enables users to explore, visualize, and analyze spatial and non-spatial data in a highly interactive environment. In this blog post, we will explore how ArcGIS Insights can be leveraged for data-driven decision making, highlighting its key features, benefits, and real-world applications.
What is ArcGIS Insights?
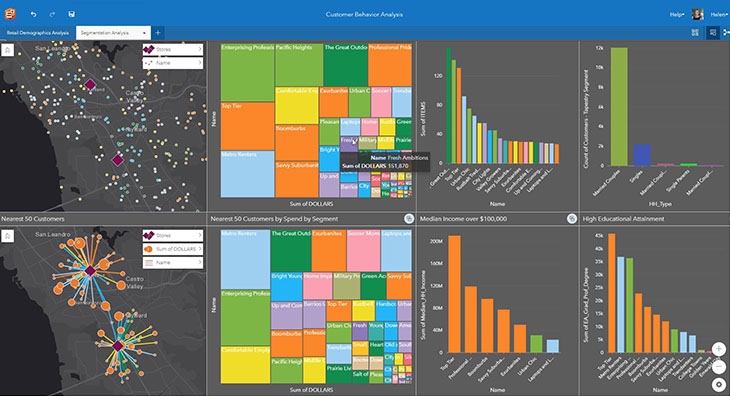
ArcGIS Insights is a self-service analytics platform designed to transform data into actionable insights. It allows users to integrate spatial and non-spatial data from various sources, perform advanced analytics, and create compelling visualizations. By combining the power of GIS with advanced data analysis capabilities, ArcGIS Insights empowers organizations to make informed decisions based on comprehensive data analysis.
Related: ArcGIS Insights: A Comprehensive Data Analysis Tool for GIS Professionals
Key Features of ArcGIS Insights
- Interactive Data Exploration:
- ArcGIS Insights provides a highly interactive environment for exploring data. Users can drag and drop datasets, create visualizations, and perform analyses without writing code.
- The platform supports a wide range of data formats, including CSV, Excel, shapefiles, and database connections.
- Advanced Analytics Tools:
- The platform offers a suite of advanced analytics tools, including spatial analysis, statistical analysis, and predictive modeling.
- Users can perform clustering, regression, time series analysis, and more to uncover patterns and trends in their data.
- Seamless Data Integration:
- ArcGIS Insights integrates seamlessly with other ArcGIS products, such as ArcGIS Online and ArcGIS Enterprise, allowing users to incorporate maps, layers, and GIS data into their analyses.
- It also supports integration with third-party data sources, enabling users to combine data from multiple platforms.
- Compelling Visualizations:
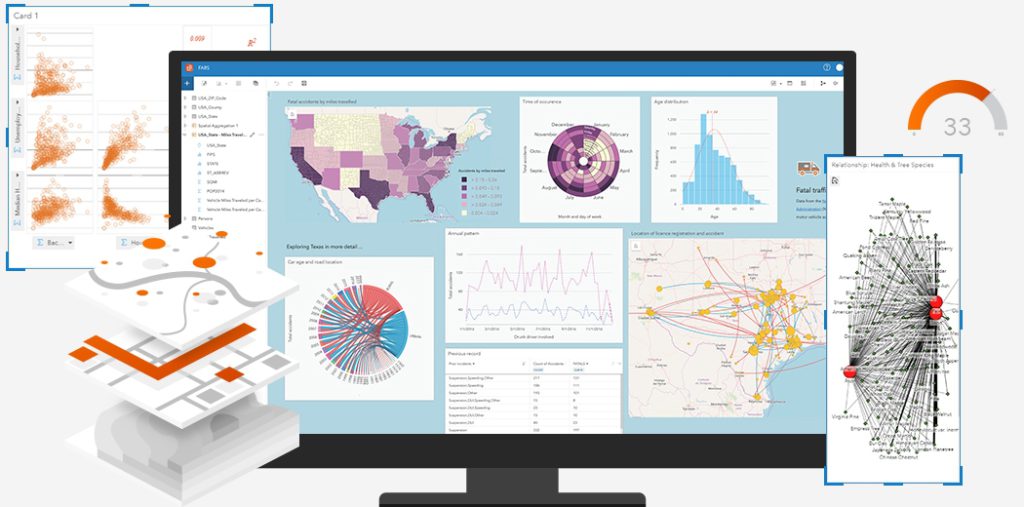
- Users can create a variety of visualizations, including maps, charts, tables, and dashboards, to effectively communicate their findings.
- The platform supports dynamic filtering and cross-filtering, allowing users to interact with their data and gain deeper insights.
- Collaboration and Sharing:
- ArcGIS Insights enables users to share their analyses and visualizations with others within their organization or with external stakeholders.
- Users can publish their results as interactive reports or embed them in web applications and dashboards.
Benefits of Using ArcGIS Insights for Data-Driven Decision Making
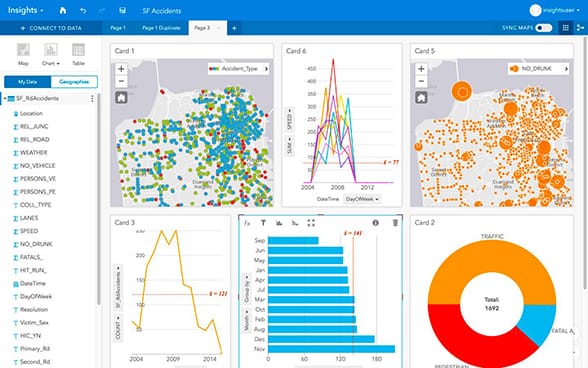
- Enhanced Understanding of Data: ArcGIS Insights combines spatial and non-spatial data, allowing users to gain a comprehensive understanding of their data. This holistic view enables organizations to uncover hidden patterns and relationships that may not be apparent through traditional analysis methods.
- Improved Decision Making: By providing advanced analytics tools and interactive visualizations, ArcGIS Insights helps organizations make data-driven decisions. Users can quickly analyze large datasets, identify trends, and make informed decisions based on real-time data.
- Increased Efficiency: The platform’s intuitive drag-and-drop interface and powerful analytics tools streamline the data analysis process. Users can perform complex analyses and create visualizations without the need for extensive coding or technical expertise, increasing efficiency and reducing time to insights.
- Enhanced Collaboration: ArcGIS Insights facilitates collaboration by enabling users to share their analyses and visualizations with others. This collaborative approach ensures that all stakeholders have access to the same information, promoting transparency and informed decision making.
- Scalability and Flexibility: ArcGIS Insights is a scalable platform that can handle large datasets and complex analyses. Its flexibility allows organizations to adapt the platform to their specific needs, whether they are conducting spatial analysis, statistical analysis, or predictive modeling.
Real-World Applications of ArcGIS Insights
- Urban Planning and Development: Urban planners can use ArcGIS Insights to analyze demographic data, land use patterns, and infrastructure needs. By combining spatial and non-spatial data, planners can make informed decisions about zoning, transportation, and community development.
- Public Health: Public health officials can leverage ArcGIS Insights to analyze the spread of diseases, vaccination rates, and healthcare access. The platform’s advanced analytics tools help identify hotspots, assess the effectiveness of interventions, and allocate resources effectively.
- Environmental Monitoring: Environmental organizations can use ArcGIS Insights to monitor and analyze environmental data, such as air and water quality, wildlife populations, and climate change impacts. The platform’s spatial analysis capabilities enable users to identify trends and develop strategies for environmental conservation.
- Retail and Market Analysis: Retailers can use ArcGIS Insights to analyze sales data, customer demographics, and market trends. By integrating spatial data, retailers can identify optimal store locations, target marketing efforts, and optimize supply chain operations.
- Transportation and Logistics: Transportation agencies can leverage ArcGIS Insights to analyze traffic patterns, transportation networks, and logistics data. The platform’s advanced analytics tools help optimize routes, improve traffic management, and enhance transportation planning.
Steps to Get Started with ArcGIS Insights
- Prepare Your Data: Gather and prepare the datasets you want to analyze. Ensure that your data is clean, accurate, and properly formatted. ArcGIS Insights supports a wide range of data formats, so you can integrate data from multiple sources.
- Create an ArcGIS Insights Workbook: Log in to ArcGIS Insights and create a new workbook. A workbook is a container for your data, analyses, and visualizations. You can add multiple pages to your workbook, each containing different analyses and visualizations.
- Add and Explore Your Data: Drag and drop your datasets into the workbook and explore the data. Use the platform’s interactive tools to filter, sort, and visualize your data. ArcGIS Insights allows you to create maps, charts, tables, and dashboards to represent your data visually.
- Perform Advanced Analyses: Use ArcGIS Insights’ advanced analytics tools to perform spatial analysis, statistical analysis, and predictive modeling. The platform provides a range of tools and functions to help you uncover patterns and trends in your data.
- Create Compelling Visualizations: Design visualizations that effectively communicate your findings. Customize your maps, charts, and dashboards to highlight key insights and make your data more accessible to your audience.
- Share Your Insights: Share your analyses and visualizations with others by publishing them as interactive reports or embedding them in web applications and dashboards. ArcGIS Insights makes it easy to share your findings with stakeholders and collaborate on data-driven decision making.
By leveraging ArcGIS Insights, organizations can gain deeper insights into their data, improve decision making, and drive better outcomes. Whether you are involved in urban planning, public health, environmental monitoring, retail, or transportation, ArcGIS Insights can help you unlock the full potential of your data and make informed decisions based on comprehensive analysis.

